Welcome to UsdCadCurrency.com, the hub for Forex USD/CAD Trading insights. This guide shows you how to trade the USD/CAD pair in 2025—covering trading hours, spreads, oil price correlation, and practical strategies to improve your forex performance.
Table of Contents
Overview of the USD/CAD Forex Pair
What is USD/CAD?
The USD/CAD is a major forex pair that measures the value of the USD compared with the Canadian dollar (CAD). In this pair, the USD is the base currency, while the CAD is the quote currency.
- If the USD/CAD is trading at 1.35, it means 1 U.S. dollar equals 1.35 Canadian dollars.
- A rising USD/CAD rate indicates a stronger U.S. dollar or a weaker Canadian dollar.
- A falling rate suggests the opposite: a weaker USD or a stronger CAD.
For a deeper introduction to this pair, including its history and who typically tracks it, see our guide What is USD to CAD?
Why traders focus on USD/CAD?
Strong economic ties between the U.S. and Canada
Canada and the United States are among the world’s largest trading partners. Over 75% of Canadian exports go to the U.S., and energy products, cars, and agricultural goods dominate the flow. Because of this tight trade link, shifts in the U.S. economy or Federal Reserve policy directly influence the Canadian dollar.
Correlation with oil exports
Canada is a leading exporter of crude oil, and the CAD is often called a “petro-currency.”
- When oil prices rise, the Canadian economy benefits, strengthening the CAD and often pushing USD/CAD lower.
- When oil prices fall, the CAD weakens, and USD/CAD tends to climb.
This oil correlation makes USD/CAD especially popular with traders who follow energy markets alongside forex.
Comparison with Other Forex Pairs
USD/CAD vs EUR/USD
- Volatility: EUR/USD is generally less volatile than USD/CAD because it is less influenced by commodity swings.
- Spread: EUR/USD usually has a tighter spread (0.5–1 pip) compared to USD/CAD (1–2 pips on many brokers).
- Takeaway: Traders who want stability and very low costs often prefer EUR/USD, but those seeking opportunities from volatility may focus on USD/CAD.
- 📌 See: USD vs EUR comparison
USD/CAD vs GBP/USD
- Trading Hours: GBP/USD is most active during the London session, while USD/CAD tends to show more liquidity during the New York session.
- Liquidity: GBP/USD is also highly liquid, but USD/CAD volume spikes when U.S. and Canadian economic news overlap.
- Takeaway: USD/CAD is better suited for North American traders active during U.S. hours, while GBP/USD suits those trading the European morning.
- 📌 See: USD vs GBP comparison
USD/CAD Trading Hours and Best Time to Trade
Forex market sessions (New York, London overlap)
The forex market is open 24 hours a day, but not all hours offer the same opportunities. For the USD/CAD pair, the most important trading activity happens during the New York session. Since both the U.S. and Canada are in similar time zones, most of the liquidity for USD/CAD occurs when North America is active.
- Asian session (Tokyo, Sydney): Lower liquidity, smaller price moves.
- London session: Some activity, but USD/CAD is not as active as EUR/USD or GBP/USD.
- New York session: Peak volume and volatility, as both the U.S. and Canadian markets are open.
When the London and New York sessions overlap (8:00–11:00 ET), USD/CAD often experiences its strongest trading activity.
Best time to trade USD/CAD (8:00–11:00 ET)
The sweet spot for USD/CAD trading is typically between 8:00 AM and 11:00 AM ET.
- This period coincides with the release of U.S. and Canadian economic data.
- Liquidity is high, spreads are tighter, and intraday volatility creates clear setups for day traders and scalpers.
- During this window, traders can catch strong directional moves or breakouts driven by data such as employment figures, GDP, or inflation reports.
If you are trading longer-term strategies like swing trading, you don’t have to limit yourself to these hours, but short-term traders gain the most edge during this window.
Volatility patterns during news releases (NFP, BoC)
USD/CAD reacts strongly to scheduled economic news:
- Non-Farm Payrolls (NFP – U.S.): Published on the first Friday of every month, this often creates sharp USD moves that directly affect USD/CAD.
- Bank of Canada (BoC) policy announcements: Interest rate decisions or monetary policy statements can trigger sudden CAD strength or weakness.
- U.S. CPI & Canadian CPI: Inflation data from either side can fuel volatility as traders adjust expectations for Fed or BoC policy.
Traders should be cautious during these releases: spreads may widen, slippage may occur, and stop-loss levels can be hit quickly. However, news trading can also provide significant profit opportunities if managed properly.
📌 For daily and weekly outlooks on how upcoming events may move the USD/CAD pair, see our USD/CAD Forecasts.

USD/CAD Spread, Liquidity, and Volatility
Typical spread vs EUR/USD or GBP/USD
Among the major forex pairs, USD/CAD typically has a slightly wider spread than EUR/USD but narrower than many exotic pairs.
- EUR/USD: often 0.5–1 pip on major brokers (the most liquid forex pair).
- GBP/USD: usually 1–2 pips, sometimes higher during volatility.
- USD/CAD: commonly 1–2 pips, depending on broker type and market conditions.
For day traders and scalpers, this spread difference matters because transaction costs directly affect profitability.
How brokers set USD/CAD spread (ECN vs Market Maker)
Not all brokers price USD/CAD the same way.
- Brokers operating on an ECN (Electronic Communication Network) model
- Provide traders with raw interbank pricing.
- Spreads may be as low as 0.3–0.5 pips during high liquidity.
- They usually take a small commission on each trade.
- Market Makers:
- Offer fixed or slightly wider spreads (1.5–2 pips on USD/CAD).
- Prices can be re-quoted in periods of high volatility.
- Attractive for beginners but less cost-efficient for active traders.
👉 Understanding broker models helps traders choose the right setup depending on their strategy (scalping, swing trading, or long-term).
Factors driving USD/CAD volatility
Fed-controlled U.S. interest rates
Decisions by the Federal Reserve on interest rates have a direct impact on USD strength. When the Fed raises rates, the USD often strengthens, pushing USD/CAD higher if Canada’s rates remain unchanged.
📌 See full analysis: USD/CAD vs Interest Rates
Monetary decisions of the Bank of Canada
As Canada’s central bank, the BoC plays a crucial role in CAD valuation.
- Hawkish BoC (rate hikes, tightening policy) → strengthens CAD → USD/CAD may fall.
- Dovish BoC (rate cuts, easing policy) → weakens CAD → USD/CAD may rise.
Oil price fluctuations
Canada is one of the world’s largest crude oil exporters, and CAD is known as a commodity-linked currency.
- Rising oil prices boost Canada’s trade balance and CAD value → USD/CAD tends to drop.
- Falling oil prices weaken CAD → USD/CAD tends to climb.
📌 See in-depth guide: USD/CAD vs Oil
Economic Indicators Affecting USD/CAD
The USD/CAD pair is highly sensitive to macroeconomic data from both the United States and Canada. Traders monitor these indicators closely because they directly influence expectations for the Federal Reserve (Fed) and the Bank of Canada (BoC), which in turn drive forex volatility.
U.S. economic data (NFP, CPI, GDP)
- Non-Farm Payrolls (NFP):
Released monthly, the NFP report is one of the most watched economic releases in forex. Strong job growth in the U.S. often supports the USD, while weak data can trigger USD/CAD declines. - Consumer Price Index (CPI):
Inflation plays a central role in Federal Reserve policy. A higher-than-expected CPI fuels speculation of rate hikes, usually pushing the USD higher against CAD. - Gross Domestic Product (GDP):
U.S. GDP growth signals economic strength and typically boosts the USD. Conversely, weaker growth expectations can weaken USD/CAD.
Canadian economic data (employment, CPI, GDP growth)
- Employment figures:
Canada’s monthly jobs report, often released the same day as U.S. NFP, creates sharp USD/CAD volatility. Strong Canadian job growth can strengthen CAD and push USD/CAD lower. - Canadian CPI:
Inflation readings from Statistics Canada guide BoC interest rate policy. Higher CPI readings may prompt BoC tightening, strengthening CAD.
📌 See: USD/CAD vs Inflation - Canadian GDP:
As a resource-driven economy, Canada’s GDP is closely tied to trade and commodity performance. Higher-than-expected growth supports CAD strength.
Oil inventory reports & trade balance
- EIA and API crude oil stock data
Because oil is Canada’s largest export, changes in supply-demand balance directly affect CAD. A drop in U.S. oil inventories often boosts oil prices, supporting CAD and weighing on USD/CAD. - Trade balance data:
Canada’s trade surplus or deficit provides clues about CAD demand.- Trade surplus → more demand for CAD, USD/CAD may fall.
- Trade deficit → weaker CAD, USD/CAD may rise.
📌 Related: USD/CAD and Import-Export
👉 In summary, USD/CAD traders must watch NFP, CPI, and GDP from both countries, as well as oil and trade reports. These indicators often spark the most significant intraday moves in the pair.
The Role of Oil Prices in USD/CAD Trading
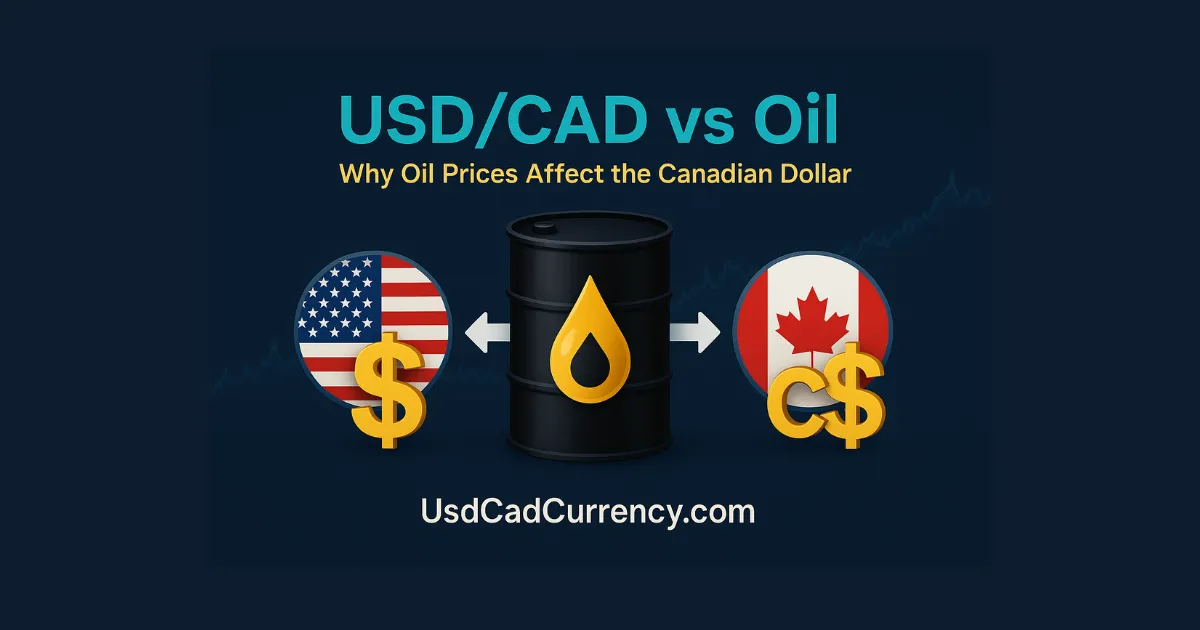
Why CAD is a “petro-currency”
The Canadian dollar is often called a “petro-currency” because Canada is one of the world’s top crude oil exporters. Oil accounts for a large share of Canada’s export revenue, and higher oil prices typically improve the Canadian economy.
- When oil prices rise, Canada earns more from exports → CAD strengthens → USD/CAD tends to fall.
- When oil prices drop, export revenue shrinks → CAD weakens → USD/CAD tends to rise.
This strong relationship means oil traders and forex traders often track USD/CAD together.
Case study: Oil shock impact on USD/CAD
A clear example is the 2020 oil price crash during the COVID-19 pandemic:
- Crude oil futures briefly went negative in April 2020.
- The Canadian dollar lost significant value as export revenues collapsed.
- As a result, USD/CAD spiked above 1.45, its highest level in nearly two decades.
On the other hand, during the oil rally of 2021–2022, when crude rose above $100 per barrel, the CAD strengthened, and USD/CAD moved back down toward 1.20.
These historical events highlight how oil shocks directly shape the USD/CAD exchange rate.
How to use oil correlation in trading setups
Traders often use oil prices as a leading indicator for USD/CAD movements.
- If oil is trending upward, traders may anticipate CAD strength and look for short USD/CAD opportunities.
- If oil is falling sharply, traders may expect CAD weakness and look for long USD/CAD setups.
- Combining oil price charts with technical indicators (moving averages, RSI) helps confirm trade entries.
📌 For broader macroeconomic context, see our USD vs CAD comparison
👉 In summary, oil is one of the most important drivers of USD/CAD volatility. By tracking crude oil trends, traders can anticipate currency movements and align their forex strategies with global energy markets.
Popular USD/CAD Trading Strategies
The USD/CAD pair offers opportunities for different types of traders, from short-term scalpers to long-term swing traders. Because of its liquidity and correlation with oil and interest rates, USD/CAD reacts well to both technical analysis and economic news events.
Day Trading USD/CAD
Scalping setups, low spread benefit
USD/CAD is a favorite for day traders and scalpers because spreads are relatively low compared to many pairs. Scalpers often target 5–15 pip moves during high-liquidity hours, typically the New York session.
- Strategy: Use 1–5 minute charts with indicators such as moving averages or Bollinger Bands.
- Tip: Focus on 8:00–11:00 ET, when spreads tighten and volatility increases due to overlapping sessions.
Example intraday chart
An intraday USD/CAD chart often shows sharp movements during U.S. or Canadian news releases. For example:
- A better-than-expected U.S. NFP report → USD strengthens → quick rally in USD/CAD.
- A strong Canadian jobs report → CAD strengthens → intraday drop in USD/CAD.
Swing Trading USD/CAD
Trend-based strategies with support and resistance
Swing traders look for multi-day or multi-week trends. USD/CAD often establishes clear support and resistance zones driven by oil prices and interest rate expectations.
- Strategy: Use daily or 4-hour charts with moving averages (50-day, 200-day).
- Example: If USD/CAD breaks above long-term resistance at 1.35, traders may look for long setups toward 1.38–1.40.
Swing strategies benefit from holding positions through economic cycles but require wider stop-loss levels due to volatility.
News Trading
Fed, BoC, oil inventory reports
News trading is popular with USD/CAD because the pair reacts sharply to scheduled events:
- Federal Reserve announcements: Rate hikes strengthen USD → USD/CAD rallies.
- Bank of Canada decisions: Hawkish BoC strengthens CAD → USD/CAD drops.
- Oil inventory reports: Falling inventories (oil prices up) → CAD strengthens → USD/CAD falls.
⚠️ News trading carries higher risk due to slippage and spread widening, but it also presents high-reward opportunities for experienced traders.
📌 For historical patterns and past performance around these events, see our USD/CAD Historical Data
Technical Analysis on USD/CAD
Technical analysis is one of the most effective ways to trade the USD/CAD pair. Because of its high liquidity and sensitivity to economic news, USD/CAD responds well to classic chart patterns and indicators such as moving averages, RSI, and MACD.
Moving averages (MA50, MA200 crossovers)
Moving averages assist traders in spotting the general market trend.
- MA50 (short-term) vs MA200 (long-term) are commonly used.
- A golden cross occurs when the MA50 moves above the MA200 → bullish signal for USD/CAD.
- A death cross occurs when the MA50 falls below the MA200 → bearish signal.
- Many swing traders use these crossovers to confirm entry and exit points on 4-hour or daily charts.
RSI and MACD setups
- Relative Strength Index (RSI):
- Assesses market momentum for overbought/oversold states.
- RSI above 70 may signal USD/CAD is overbought → potential pullback.
- RSI below 30 may indicate oversold conditions → possible rebound.
- MACD oscillator (Moving Average Convergence Divergence):
- Indicates changes in momentum and possible trend reversals.
- A MACD line crossing above the signal line → bullish setup.
- A MACD line crossing below the signal line → bearish setup.
Combining RSI and MACD with moving averages helps reduce false signals.
Support & resistance zones
USD/CAD frequently reacts to key psychological levels such as 1.30, 1.35, and 1.40.
- Support zones: past lows where buying pressure is expected.
- Resistance zones: past highs where selling pressure often appears.
- Price action around these levels, combined with candlestick patterns, can create high-probability setups.
Traders often use historical charts to identify these levels, then align them with news releases or oil price movements for confirmation.
📌 For interactive charts and real-time indicators, check our USD/CAD Technical Analysis Tool
Managing Risks When Trading the USD/CAD Pair
Trading USD/CAD can be highly profitable, but like any forex pair, it also carries risks. Effective risk management is essential to protect capital and maintain consistent performance.
Proper position sizing with leverage management
Many traders fail not because of bad analysis but because they use excessive leverage.
- Position sizing: Only risk 1–2% of account equity per trade.
- Leverage: Even though brokers may offer 1:100 or higher, using moderate leverage (1:10–1:20) is safer for USD/CAD due to its volatility.
- Example: On a $10,000 account, risking 1% means a maximum loss of $100 per trade.
Stop-loss and take-profit
- Stop-loss orders protect traders from catastrophic losses during sharp moves caused by news or oil shocks.
- Place stops beyond key support/resistance zones to avoid being taken out by noise.
- Take-profit levels should be set using risk-reward ratios. A minimum of 1:2 (risk $100 to make $200) ensures long-term profitability.
Preventing overtrading in volatile markets
USD/CAD often spikes during events like NFP or BoC announcements. While tempting, chasing every move leads to mistakes.
- Follow your trading plan rather than letting emotions drive decisions.
- Reduce lot size or skip trading entirely during periods of extreme volatility if you’re inexperienced.
- Track spreads: during major announcements, spreads may widen significantly, raising costs.
📌 For cost efficiency beyond spreads and swaps, also consider the Cheapest Way to Convert USD to CAD — understanding real-world conversion costs helps forex traders appreciate the impact of fees.
Visual Aids & Data for Traders
To make USD/CAD trading insights more practical, visual data is essential. Charts and tables help traders quickly understand patterns, compare spreads, and evaluate correlations.
Historical USD/CAD volatility charts
Looking at historical volatility gives traders a sense of when the pair is most active.
- Daily volatility: USD/CAD tends to move more during the New York session, especially on days with U.S. and Canadian data releases.
- Seasonal volatility: Certain months (e.g., when oil demand peaks or during rate decision cycles) see sharper moves.
- Traders can use historical volatility charts to adjust stop-loss distances or position sizing.
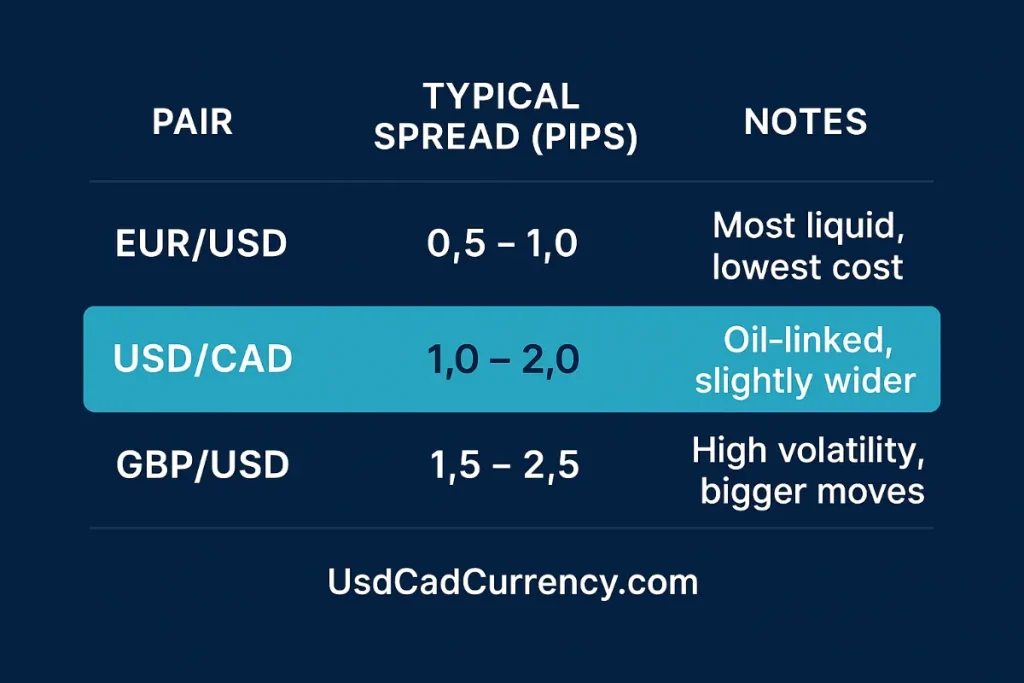
Spread comparison table (USD/CAD vs majors)
A table comparing typical spreads helps traders decide if USD/CAD suits their strategy:
| Pair | Typical Spread (pips) | Notes |
|---|---|---|
| EUR/USD | 0.5 – 1.0 | Most liquid, lowest cost |
| USD/CAD | 1.0 – 2.0 | Slightly wider due to oil link |
| GBP/USD | 1.5 – 2.5 | Greater volatility brings stronger market moves |
| USD/JPY | 0.7 – 1.2 | Strong Asian session activity |
👉 This comparison shows that USD/CAD is competitive but not as tight as EUR/USD.
Oil vs USD/CAD correlation chart
Because CAD is a commodity-linked currency, overlaying oil prices with USD/CAD gives valuable trading clues.
- When oil rallies, CAD tends to strengthen, pushing USD/CAD lower.
- When oil falls, CAD weakens, pushing USD/CAD higher.
- A correlation chart (oil vs USD/CAD over time) helps traders visually confirm this inverse relationship.
👉 Traders who follow both energy markets and forex can use this correlation to anticipate moves before they happen.
USDCADCurrency – Common Questions & Answers
USDCADCurrency – Common Questions & Answers
What is the optimal trading session for USD/CAD?
Typically 8:00–11:00 ET (New York–London overlap), when liquidity and volatility are highest for USD/CAD. This is also when most U.S. and Canadian economic data is released.
Is USD/CAD good for scalping?
Yes. Spreads are competitive (often 1–2 pips) and liquidity is strong during the New York session. Many traders scalp USD/CAD for 5–15 pip moves, but strict risk management is required around news events.
How does the price of oil shape USD/CAD trading?
USD/CAD and oil are usually inversely correlated. Rising oil prices strengthen the Canadian dollar, pushing USD/CAD lower. Falling oil prices weaken CAD, pushing USD/CAD higher.
Which indicators work well on USD/CAD?
Popular setups include MA50/MA200 crossovers for trend confirmation, RSI for overbought/oversold levels, MACD for momentum shifts, and key support/resistance zones for entries and exits.
Conclusion – Is USD/CAD a Good Pair to Trade?
The Forex USD/CAD Trading pair is one of the most attractive options for both beginner and experienced traders. Its liquidity, close ties between the U.S. and Canadian economies, and strong correlation with oil prices make it highly responsive to technical and fundamental strategies.
Strengths: liquidity, oil correlation
- High liquidity: USD/CAD offers consistent trading opportunities during the New York session, with manageable spreads compared to other majors.
- Oil correlation: Canada’s role as a major oil exporter adds a unique dimension, allowing traders to combine forex and commodity analysis for an edge.
Risks: volatility, news events
- Economic news shocks: Releases like NFP, BoC policy decisions, and inflation data can trigger sudden price spikes.
- High volatility: While volatility creates profit potential, it can also lead to unexpected losses if risk is not managed properly.
Final takeaway
USD/CAD is a pair worth trading if you understand its drivers and apply disciplined strategies. By combining technical analysis, economic awareness, and risk management, traders can take advantage of its unique characteristics.
📌 Before entering the market:
- Always check the Live USD to CAD Rate to confirm current conditions.
- Review the USD/CAD Forecasts for daily and long-term outlooks.
📌 Want more updates and daily insights on Forex USD/CAD Trading? Follow us on Facebook for fresh analysis and rate alerts.
Disclaimer: This material is intended solely for informational use and is not financial or investment guidance. Trading forex involves risk, including possible loss of capital.